Climate Change Explorer
by Gerald Kimmersdorfer and Dominik Wolf


 Start exploring

 Start exploring
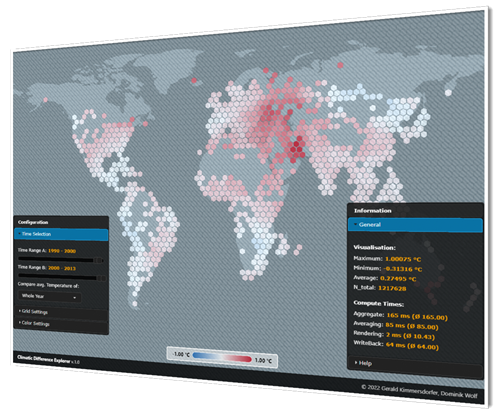
The Climate Change Explorer lets you compare aggregated temperature values over two different periods of time. The database comes from the Berkeley Earth Organization and encompasses more than 8 million individual measurements.
WebGPUs Compute Shader are used to accumulate and rasterize this data in realtime. Additionally a classical rendering pipeline is used to draw the aggregated bins and the world map.
The tool was written by Gerald Kimmersdorfer and Dominik Wolf for the course Real-Time Visualization in the winter semester 2022.
* Although WebGPU has not reached final standardization or implementation across all major browsers as of May 2023, it has already been activated as a default feature in Google Chrome, beginning with version 113.